Size a rooftop solar system
around the bill you actually pay
Enter your average monthly bill and the share of it you use in daylight, then read off the system size, the roof area, what the panels save each month, and the year the system pays for itself. Every figure comes from Thailand's average peak-sun hours.
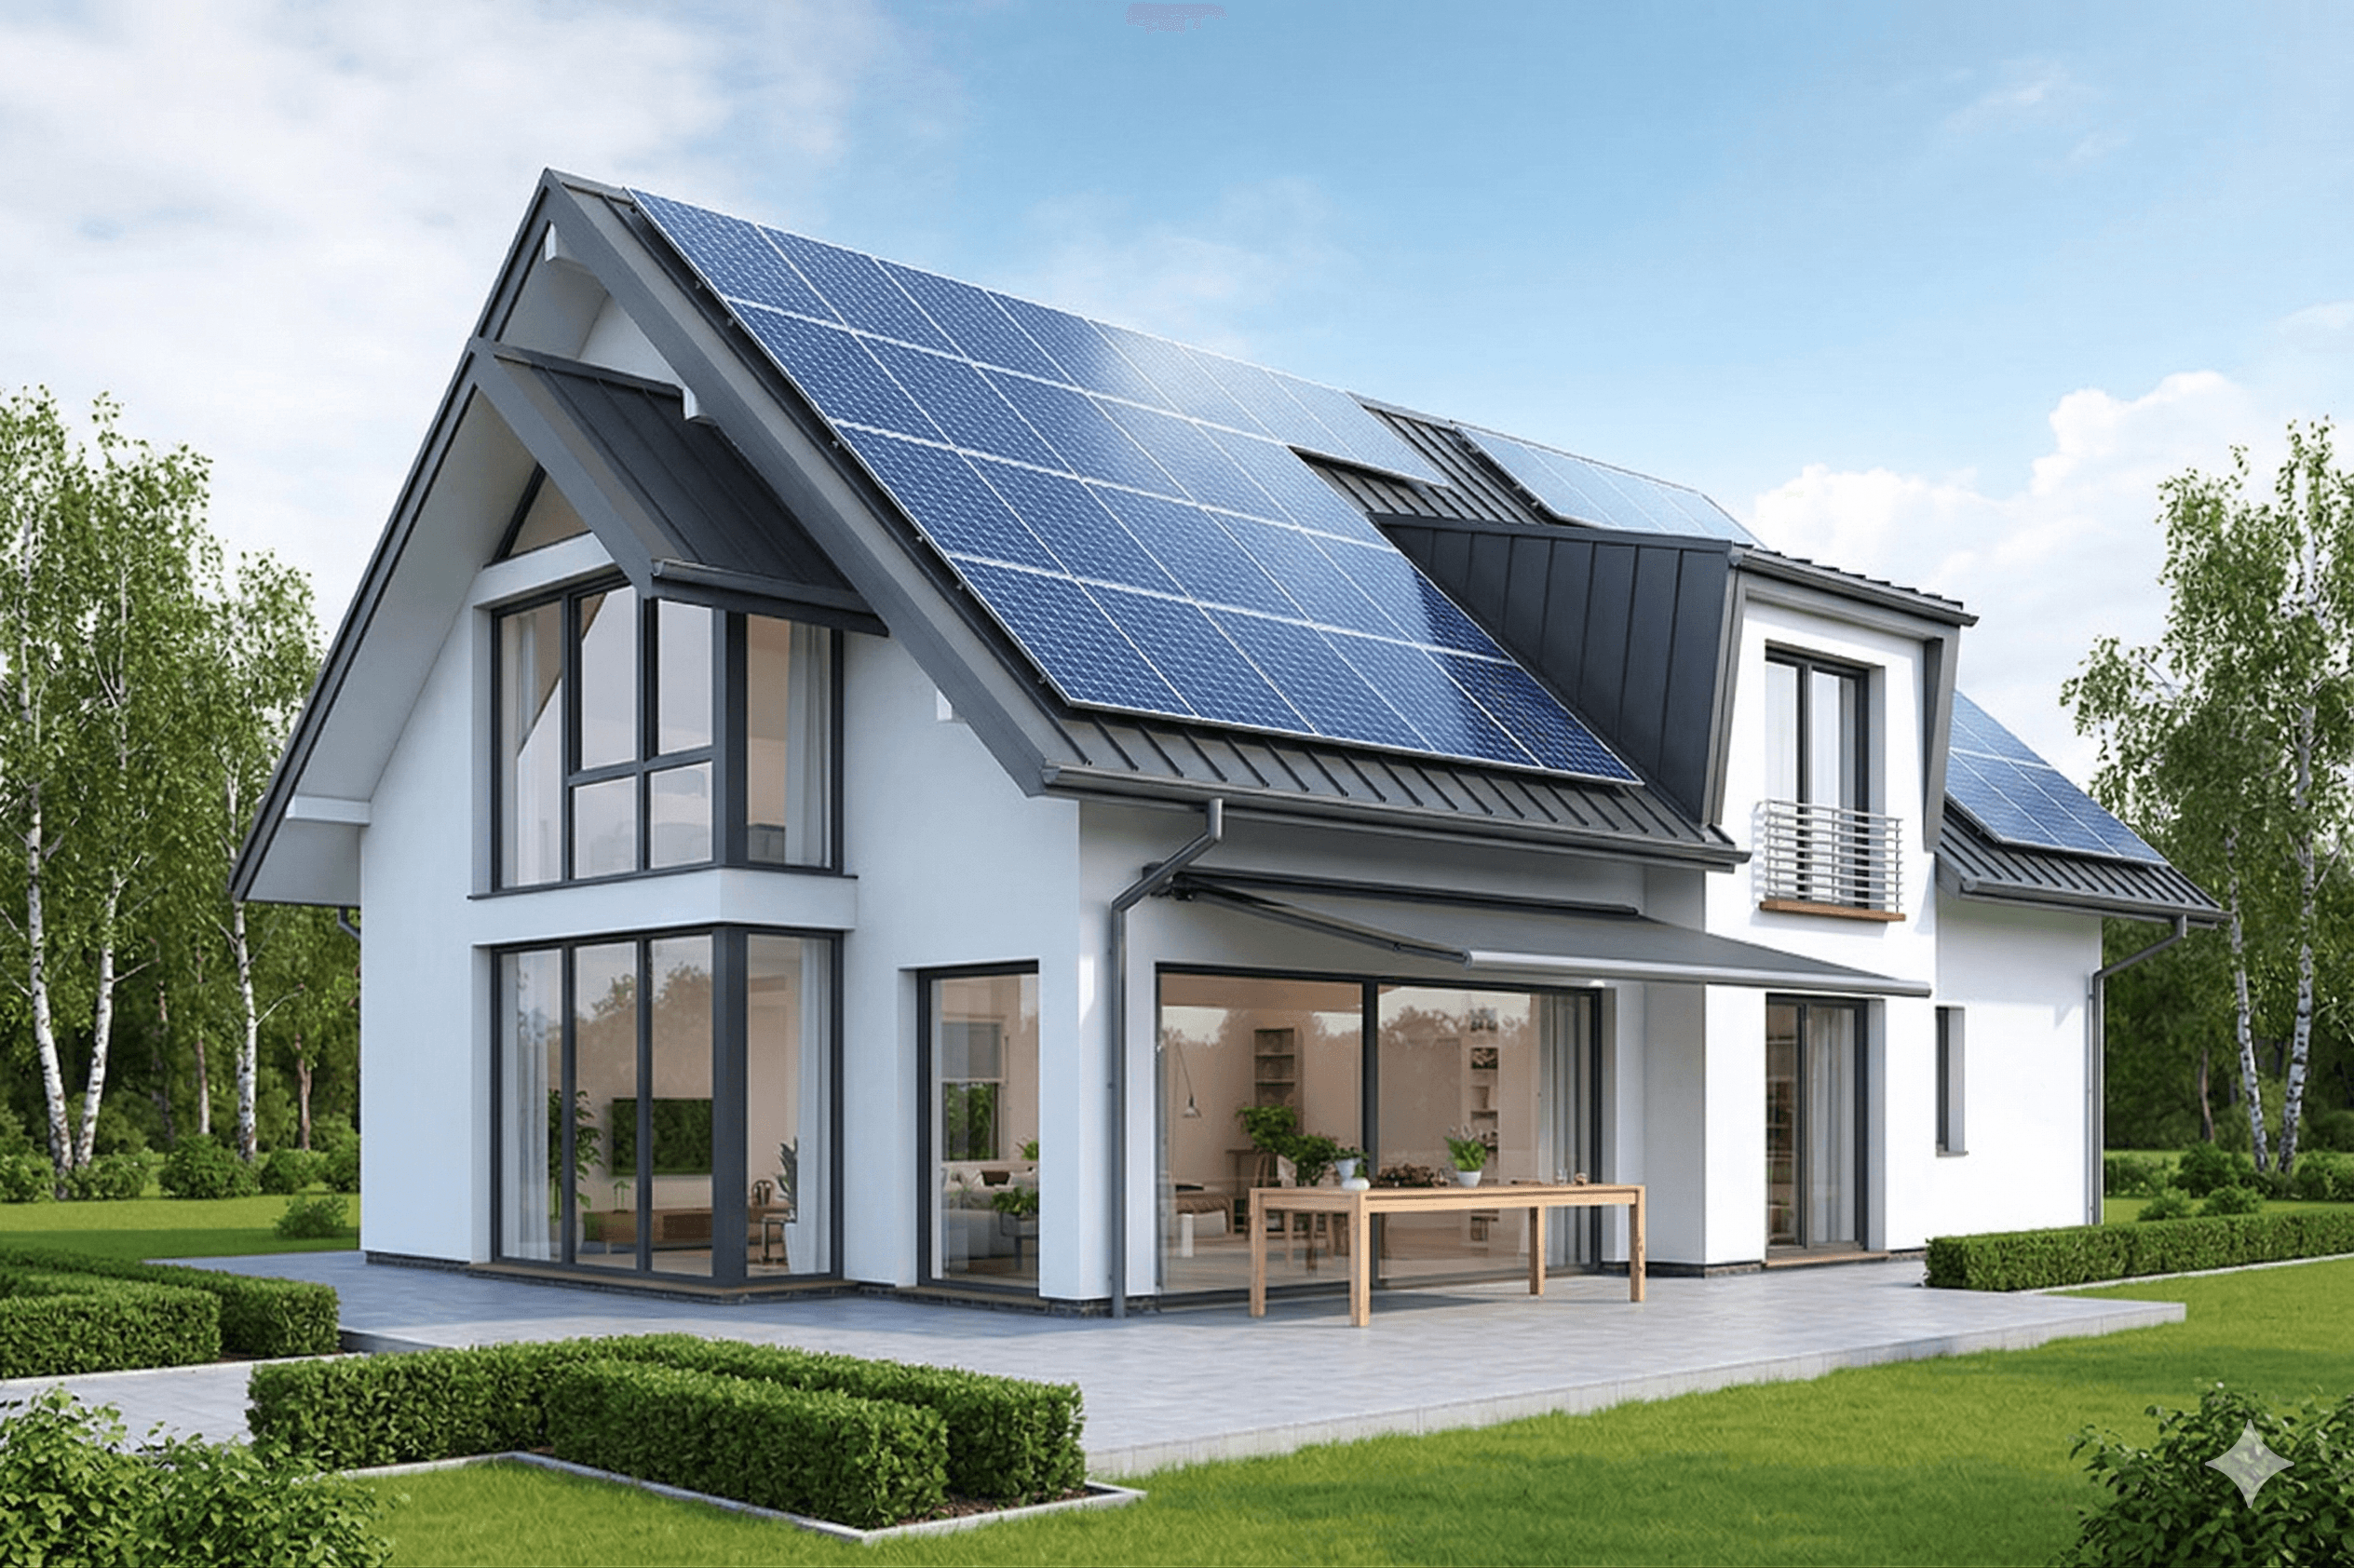
A rooftop solar installation.
The size that fits your home
Panels only generate in daylight, so the size worth paying for comes from the daytime half of the bill rather than the whole of it.
A home with someone in it during the day, or the aircon running through the afternoon, uses more of what the panels make. This is the number that moves the recommendation most.
19.84kW
From a 4.2 baht/unit tariff, 5 peak-sun hours a day (about 4 kWh per kWp after losses), and 50% of the bill spent in daylight.
- Roof area needed
- 115.5 sq.m.
- Panels, approximately
- 43 panels
- Nearest package
- 19.35 kW
Roof area, panel count and price come from the real installation package closest to the recommended size, using 450-watt panels.
What it costs and what it returns
The electricity the system saves each month, against what it costs to install and the year it pays for itself.
- Generated each month
- 2,322 kWh/mo
- Saved each year
- 117,029 THB/yr
- Installed cost, approximately
- 429,000 THB
- Payback period
- 3.7 years
Payback is read off the same accumulated-profit series as the chart below, which already accounts for panel output falling, the tariff rising and yearly upkeep. Every figure follows the real installation package closest to the recommended size.
Returns over 25 years
Once the system has paid for itself, every month of electricity it saves becomes accumulated profit.
Accumulated profit and break-even
Accumulated profit after the installed cost and the yearly upkeep.
View as a table
| Year | Accumulated profit (baht) |
|---|---|
| 1 | −314,636 |
| 2 | −198,589 |
| 3 | −80,836 |
| 4 | 38,649 |
| 5 | 159,891 |
| 6 | 282,915 |
| 7 | 407,749 |
| 8 | 534,418 |
| 9 | 662,950 |
| 10 | 793,370 |
| 11 | 925,708 |
| 12 | 1,059,991 |
| 13 | 1,196,248 |
| 14 | 1,334,507 |
| 15 | 1,474,798 |
| 16 | 1,617,151 |
| 17 | 1,761,595 |
| 18 | 1,908,161 |
| 19 | 2,056,880 |
| 20 | 2,207,785 |
| 21 | 2,360,905 |
| 22 | 2,516,275 |
| 23 | 2,673,926 |
| 24 | 2,833,893 |
| 25 | 2,996,209 |
The projection already accounts for panel output falling each year, the tariff rising each year, and yearly upkeep. Every assumption is listed at the foot of the page.
For a real number, let a technician survey the roof
The figures here come from averages. Every roof has its own orientation, pitch, shading and meter size, and both the site survey and the quotation are free.
This is a first estimate, not a quotation. Installed costs follow the current packages, and the real figure depends on the roof's orientation and pitch, shading, meter size and how the home uses power.